Transcript (and yes, this IS for SEO purposes)
Transcribed by TurboScribe.ai.
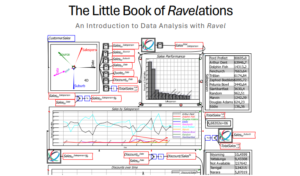
Hi, this is Kevin, and I’m a student in Steve Keen’s Revel Economist Challenge, where, amongst other things, we’re learning to use two pieces of software. One is called Minsky, and it’s a systems dynamic analysis software, and the other is called Ravel, and it’s a data display software. What you’re looking at right now is page 17 of a PDF document, which is the Ravel tutorial, and I’ve been going through the tutorial and considering the examples provided to be exercises, which I’m doing, and apparently some other students are now doing that as well, and someone sent me a message and said that he was having trouble with the exercise on page 17, which is this.
So this is my attempt to make a step-by-step video of how, starting from nothing, you build this. I break the process down into a series of discrete steps. The first step is, out there on the internet somewhere, find the data file that you need and download it.
Step two is to pre-edit the file and delete the columns that you’re not going to import into Ravel anyway. Step three is to complete the import of that data file into Ravel, attach it to a Ravel. This is the icon for data import.
This is the Ravel. This is a table display of the data in the Ravel or passing through the Ravel. So the final step is, once the file has been imported, attach it to a Ravel, set the configuration, choose to display.
So here goes. Step one. Oh, I’m skipping a step.
So the instructions here are to start with the BIS database on house prices, and that data is in what’s called the BIS data portal. And what matters most in the BIS data portal is the bulk download page, data.bis.org slash bulk download. All of the data that we will need to download from the BIS data portal is accessible on this page.
All we want are bulk downloads. However, this page is not the most easily understood. So there’s another way to get to the file that you want, which is to select topics.
In this case, we’re talking about property prices and residential property prices. So make that selection. And then from here, the way you access the bulk data file is to select data, export, bulk downloads.
From there, I’ve only ever selected the top file. The other ones are variations on a theme. But select that top file and download it to the local drive.
Now, I’ve already pre-created a folder that I’m going to save it in, Ravel tutorial page 17. And now I’m going to save the file. Now, I have to further extract the CSV file from the zip file.
So to do that, right-click, extract all. There’s only one file in the zip. I got to slide the other dialog box over from the other monitor.
Browse to the folder where I want. And it looks like I’m already in the folder that I want. And then say extract.
And if I’ve done it right, here we have the CSV file. Now, the next thing to do is to pre-edit it. A double-click will do.
Now, I don’t use Microsoft Excel. I use LibreOffice, LibreCalc. Again, it opened in my other monitor.
Now, what I’ve learned to do is to select all of the cells and then select data, auto filter. Now, this is a CSV file. So when I save it as a CSV file, I’m going to lose this auto filter.
But that’s fine. I only need it temporarily. So what I do is if a column only has a single value in the entire column, I don’t need it.
Additionally, all of the various parameters that are provided come in pairs. So for frequency, there’s a code and a name. Reference area, there’s a code and a name.
Value, there’s a code and a name. So first, frequency code, single value. Frequency name, single value.
Don’t need either of them. Delete columns. For reference area, I only need the name.
Don’t need the code. Delete columns. For value, I don’t need the code.
Delete columns. For unit measure, I don’t need the code. Delete columns.
For these three columns, there’s no values at all. So I don’t need any of them. And then all of these data files has this series column.
And this is some kind of code. I mean, this is like quarter. 5R is like the country code.
N is normal. I don’t know what 628 means. But anyway, don’t need it.
Out it goes. So when I import this into Ravel, each column will become a Ravel axis. Each value within a column will become a dimension on that axis.
And then the data, and if I scroll over to the far right, you’ll see that there is data in this file. The data will show up as the actual data. So now I’m going to save the file as a CSV.
And now I’m ready to import this CSV file into Ravel, which requires that I launch a Ravel. So bear with me. Again, it opened in the other monitor.
Now, something I always do, and it’s just a personal preference of mine, is even when I open a blank Ravel canvas, I do a file save as. And I’ll explain why in a minute. So I’m in the right directory.
And I’m going to call this Ravel tutorial. If only I could type right today. Page 17.
And the reason I do that is I’m one of these guys who believes in save your work often. So I just go file, save. And now it knows where to save it.
Okay. So the import is with the import data element. Now, in Ravel, it’s not drag and drop.
It’s click, position, click. So I’ve done that. And also, on my other monitor, this widget opens where I’m going to identify the specific file.
Here we go. It goes to the next screen automatically, although this next screen, CSV settings, is not really of much use. And Steve says that it’s going to be eliminated in a future release.
Click next. Now you’re on data selections. Now, there’s really nothing that needs to be done here because I pre-edited out all of the columns that I would have ignored in here.
Just to illustrate, let’s say that this is a column I want to ignore. Rather than axes, I select ignore. But in this case, I don’t want to ignore.
Now, I’m also not comfortable enough with the tool that I’m changing the column headings. Like reference area could be country. And unit of measure could be unit.
But what I want while I’m doing these exercises, I want to be able to have the Ravel open in one monitor, the CSV file open in another monitor. And I want to know exactly what equates to what. So by not changing these column headings, the labels will be the same in both.
However, I do need to specify the horizontal dimension. And I’m going call it quarter because I believe that’s what it’s called in the PDF. Let me check.
Yeah, he calls it quarter. So I’m going to call it quarter just to be consistent. Where’d my Ravel go? So quarter type is time.
And the format is year dash q whatever because that is the actual format. Select next. Select import.
And now on the Ravel, there were no error messages for the import. Everything looks good. Now, another level of sanity check I do, and I should have mentioned this earlier because I think it’s just a nice step to stick in there, is to verify that I’ve got the right file.
You can see that when I downloaded the file from the BIS data portal, the name was ws spp csv col. And if I go to the PDF, you’ll see that while the which letters are uppercases and which levels are lowercases and the underbar characters are missing, but you can see that it’s the same file name. And that’s how I know I’m dealing with the right file.
So back to the Ravel. I’ve imported the file, and now I’m going to feed it into a Ravel. And as you can see, data is being passed in.
I’m going to go back to the PDF. And you’ll notice this 4D. That means four dimensions are being passed out of the Ravel.
Within a Ravel, each axis has various values. And if you want to do all values, you move the selector of the values into the middle of the circle. And that’s how you’ve got 4D.
If I’m only passing all values for three axes out of the Ravel, you’ll see 3D. But in this example, we want to pass them all. And I’m going to make this Ravel match what’s in the PDF.
So reference area points to the right, and value points down. And that’s why they show in the table. So reference area to the left, value down.
Reference area to the left, value down. And now let’s throw that into a chart. And there it is.
But you’ll notice, I’m going to do one more. Well, actually, I’m going to do that one more thing in a minute. You’ll notice that in the PDF, the names of the countries are down the left, and the dimension of the axes are across the top.
And my Ravel is flipped. These are the names of the countries, and these are the axes. And I found that in the PDF, this dimension that points straight out to the right in the PDF is what appears down the left side of the table.
However, in Ravel, this is. So in order to have my chart mimic the chart that’s in the PDF, I got to flip these two axes. And now it does.
Now, you’ll also notice that their title is index 2010 equals 1. My title is 1927. And I’m not really hung up on that. I don’t really understand why that’s different, but I’m not going to let it bother me.
But then I want to go to, oh, that’s unit of measure. Let me throw that back in here. And I’m going to take unit of measure.
You can sort the order in which dimensions appear on an axis. And I’m going to go sort axes forward and see if that changes anything. No, it doesn’t.
Well, this is good enough for this exercise. We have downloaded the file from the BIS database, loaded that file into a data import element on the canvas, fed that into a Ravel, set up the Ravel the way we want, and then fed the output of the Ravel into a table. I hope this video helps.
Transcribed by TurboScribe.ai.


